

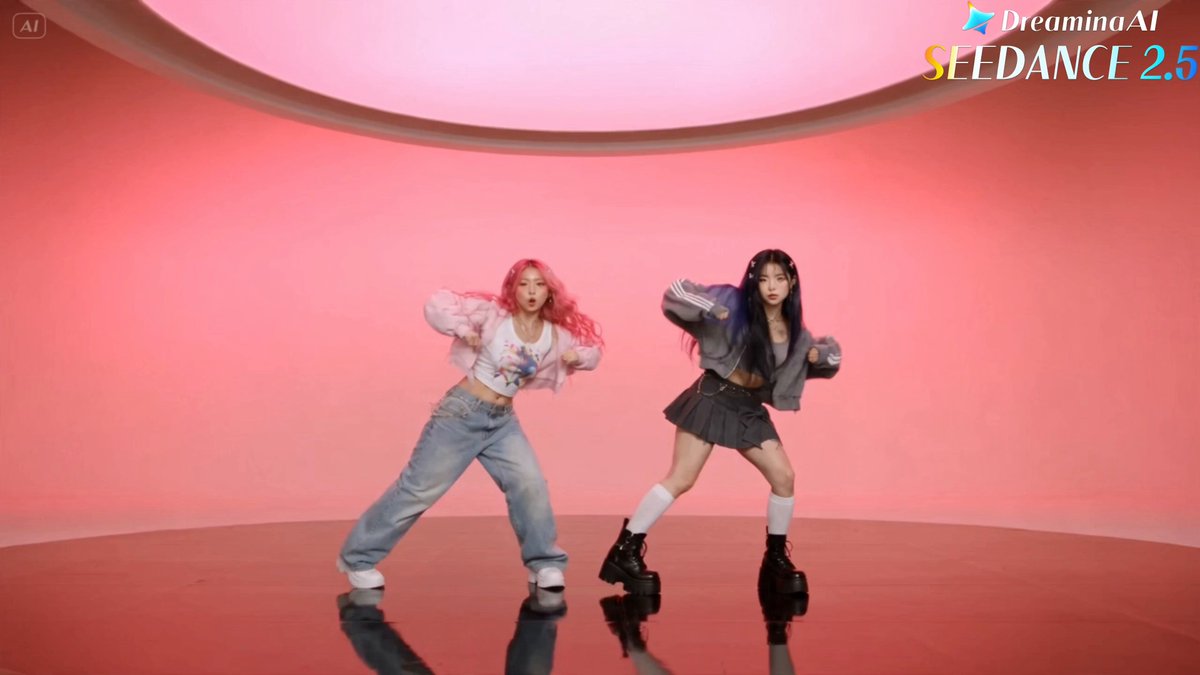


Why video analytics became the backbone of AI-era marketing
Analytics used to be something teams bolted onto video marketing after the fact: publish, wait, look at views, feel vaguely encouraged or vaguely disappointed. That model collapses the moment the video itself is generated rather than shot. When a single prompt can produce a finished twenty-second clip, the number of assets you can ship per week multiplies, and so does the number of invisible variables. Suddenly you are no longer asking "did the campaign work?" You are asking which model, which prompt phrasing, which aspect ratio, which voice, and which hook produced the retention curve you are staring at.
That shift is the whole story. Video is no longer just a marketing channel layered on top of a brand; it is the primary surface where audiences decide whether a brand feels current, competent, and worth following. Global viewers spend hours each day inside short-form and mid-form video, and the baseline visual quality they expect keeps climbing. Text-to-video systems from the major labs and fast-moving independent models have raised that bar so quickly that a rough, poorly-lit export now reads as an integrity problem rather than a budget constraint.
The practical consequence: measurement has to move upstream. Instead of measuring only the finished asset's performance, you measure the pipeline that produced it. This guide walks through how to design that pipeline, which metrics actually matter for AI-generated video, how to build a lightweight measurement stack, and how to run a weekly iteration loop that compounds instead of thrashing.
The anatomy of an AI video pipeline you can actually measure
A measurable pipeline has three things a casual workflow usually lacks: named stages, a version log, and a clear owner for each decision. Without them, you cannot attribute a performance change to anything specific, and you end up rewriting prompts randomly in the hope that something sticks.
Stage one — model selection as a tracked variable
Different generation engines have different personalities. Some excel at photoreal humans and skin texture, others at stylized motion, others at text rendering and camera moves. Treating model choice as a fixed preference rather than a variable is one of the most common analytical blind spots.
A workable convention: record the model and version for every asset, then run at least one controlled comparison per quarter where the same script and prompt structure are rendered across two engines. You are not looking for a universal winner. You are looking for a documented answer to "which engine gives us the best retention per hour of production time for this specific content type?"
Stage two — prompt engineering as an experiment log
Prompts are the closest thing video marketing now has to ad copy variants. They deserve the same discipline. Keep a shared log with four columns: prompt ID, full prompt text, model used, and outcome notes. When a clip outperforms, you want to know whether the win came from the subject description, the camera language, the lighting adjectives, or the negative constraints.
One habit that pays off immediately: freeze a "base prompt skeleton" per content format. Every experiment changes exactly one block of that skeleton. That single constraint turns guesswork into something resembling a controlled test, even when you are only shipping a handful of clips a week.
Stage three — asset management and versioning
AI pipelines generate messy file trees fast. Six variants of one clip, each with three voice options, quickly becomes unnavigable. Adopt a naming convention before you need it, for example campaign_format_model_version_language_date. Store final exports separately from working files. Tools like Frame.io, Airtable, Notion databases, or a simple structured spreadsheet all work; the tool matters far less than the discipline of one canonical record per asset.
The metric layer: what actually matters for AI-generated video
Vanity metrics are not useless, they are just not diagnostic. Views tell you distribution worked. They do not tell you why a viewer left at second three. For AI-generated content there are three metric families worth building dashboards around.
Sequence-based engagement analysis
Treat the video as a sequence of beats, not one indivisible unit. Map your timeline into segments — hook, problem framing, demonstration, proof, call to action — and attach retention and rewatch data to each segment. Most analytics platforms will not do this automatically, so either tag timestamps manually or build a simple overlay that records drop-off points against your beat structure.
The insight you are hunting for is structural, not cosmetic. If every AI clip loses thirty percent of viewers during the first generated camera move, that is a production-variable problem. If drops cluster at the transition from generated footage to a human on-camera segment, that is a coherence problem. Both are fixable, but only if you can see where the fracture happens.
Consistency and character attachment signals
AI video has a unique engagement driver: whether recurring characters, mascots, or visual motifs stay recognizable across clips. Audiences bond with continuity. When a generated character's face, wardrobe, or voice drifts between episodes, the sense of a coherent world breaks, and completion rates usually follow.
Track this with a simple internal consistency score per asset — for example, a one-to-five rating for face, wardrobe, voice, and environment continuity. Compare that score against repeat-view share and subscribe or follow conversion. You will often find that consistency correlates more strongly with audience return than raw production polish does.
Production variables as controlled experiments
Pull the variables that live upstream of publishing into your reporting: aspect ratio, clip length, voice type, subtitle style, music tempo, opening frame composition, and whether the first three seconds are generated or live action. Run these as deliberate tests with a single variable changed at a time, and record the result even when it is boring. A negative result you can cite is worth more than an anecdote you cannot.
Building a measurement stack without overengineering it
You do not need an enterprise data warehouse to do this well. You need three layers and a weekly habit.
Layer one: capture. Platform-native analytics from YouTube, TikTok, Instagram, LinkedIn, and your own site, plus on-site event tracking through a tool such as GA4, Mixpanel, or Amplitude. Capture the basics consistently: impressions, three-second retention, average watch percentage, completion rate, rewatch rate, click-through, and downstream conversion.
Layer two: enrichment. This is where most teams stop, and it is where the value sits. Append your production metadata to the performance data: model, prompt ID, iteration number, consistency score, production time, and cost per finished asset. A spreadsheet with a join key of asset_id handles this fine at small scale.
Layer three: visualization. A single dashboard in Looker Studio, Metabase, or even a well-formatted sheet, organized around three questions: which formats retain, which production variables move the needle, and what is our cost and time per winning asset.
Once the stack exists, the operating rhythm matters more than the tooling. A weekly review of twenty minutes, with one decision made per session, outperforms a monthly deep dive that produces a forty-page deck nobody reads.
A weekly operating rhythm that compounds
An effective loop looks like this:
- Monday — review. Look at last week's assets against the beat map. Identify the single biggest unexplained drop-off across the set.
- Tuesday — hypothesize. Write the hypothesis as a sentence: "If we hold the generated camera move during the hook longer than two seconds, three-second retention will improve because the viewer has time to orient." One hypothesis, one asset set.
- Wednesday to Thursday — produce. Generate three to five variants that isolate that variable. Keep everything else frozen.
- Friday — publish and tag. Same publishing window, same thumbnail style, same distribution channels where possible. Tag every asset with the hypothesis ID.
- Next Monday — decide. Adopt, discard, or retest. Write the outcome into the prompt and production log.
Twelve months of that rhythm produces a documented internal playbook of what works for your audience. That playbook is far more valuable than any single viral clip, because it makes performance repeatable rather than lucky.
Common mistakes that break AI video analytics
Changing five things at once. The most frequent error. If you switch model, prompt style, voice, length, and posting time in the same week, you have learned nothing except that something happened.
Treating generation cost as the only cost. The real cost is total time from brief to published asset, including retries, editing, sound, and captioning. Track hours, not just generation spend, or you will optimize the wrong bottleneck.
Ignoring coherence. Audiences forgive rough textures far more easily than they forgive a character whose face changes between scenes. Consistency is a measurable quality signal, not a subjective one.
Measuring only the final export. If you cannot trace performance back to a specific prompt, model, and edit decision, your analytics describe the past without informing the future.
Over-investing in dashboards. A beautiful dashboard nobody opens is a cost, not a capability. Build the smallest view that answers three questions and force yourself to use it weekly.
Skipping the negative results. Failed experiments are the cheapest research you will ever run. Log them with the same care as wins, because they prevent expensive repetition.
Choosing a tool stack: practical decision criteria
| Criterion | What to look for | Why it matters |
|---|---|---|
| Model breadth | Several generation engines available in one place | Lets you test engines without rebuilding your workflow |
| Consistency controls | Character reference, seed locking, style memory | Directly affects the engagement signals described above |
| Metadata export | Structured output you can join to performance data | Without it, enrichment is manual and stalls |
| Collaboration | Commenting, version history, approvals | Prevents silent overwrites of approved assets |
| Cost visibility | Per-asset or per-minute tracking | Feeds the true cost-per-winner metric |
| Editing path | Easy handoff to Premiere, After Effects, DaVinci Resolve, or CapCut | AI output is a starting point, not a finished product |
| Language support | Voices and captions for your target markets | Localization is often the cheapest growth lever |
A reasonable default stack for a small team: one primary generation platform, one secondary for comparison testing, a dedicated voice tool such as ElevenLabs, a lightweight editing pass in CapCut or Resolve, an asset tracker in Airtable or Notion, and one dashboard. Resist adding more until a specific bottleneck demands it.
Worked example: a six-clip campaign from brief to iteration
Suppose a mid-sized B2B software company wants to test whether AI-generated explainers can replace a portion of its live-action production. The brief: six clips, same core message, varying hook style.
Week one produces three variants of the hook — generated product close-up, animated data visualization, and a stylized abstract motion loop — all with identical body and call to action. Each clip is tagged with model, prompt ID, hook type, and consistency score. Publishing happens on the same two channels in the same daily window.
At review, three-second retention for the product close-up sits noticeably above the others, while completion rate favors the animated data visualization. That is a useful and non-obvious split: the close-up wins attention, the data visualization holds it. The next iteration pairs the close-up hook with the data-visualization body structure. That single combination, derived rather than guessed, becomes the template for the following month's content.
Note what made this possible. Not a bigger budget, not a fancier model, but a naming convention, a beat map, and the willingness to publish near-identical assets in the same window. The analytics did not produce the insight; the workflow design did.
FAQ
How many variants do I need for a meaningful test? With small audiences, three to five per variable is usually enough to spot a directional pattern. Aim for consistency in publishing conditions rather than statistical perfection.
Should I measure AI-generated video differently from live-action video? Use the same core metrics, then add production-side variables: model, prompt ID, consistency score, and generation-to-publish time. Those extra columns are what make the data actionable.
What is the single most useful metric? Average watch percentage paired with your beat map. It tells you both how much of the video landed and where it stopped landing.
How do I handle platform differences in metrics? Normalize to ratios rather than absolute counts. Watch percentage, retention at specific timestamps, and conversion rate per thousand impressions travel more reliably across platforms than raw view totals.
Where does localization fit? Test it late, not first. Once a format wins in one language, localized versions of the winner routinely outperform original productions in secondary markets, often at a fraction of the cost.
Do I need a dedicated analytics hire? No. You need one owner, one dashboard, and a fixed weekly review slot. That combination beats additional headcount in most teams under twenty people.
A checklist you can steal
Before publishing your next AI-generated video, confirm that you have: a unique asset ID, the model and version recorded, the prompt text stored, a beat map with at least four segments, an internal consistency score, a stated hypothesis for this asset, and a defined decision date. Six of those seven take under a minute each. Together they convert a stream of one-off clips into a system that learns.
That is the real shift. Video marketing analytics in an AI-driven production environment is not about watching dashboards more intensely. It is about building a pipeline whose every choice is recorded, structured, and testable, so that the next clip is measurably better than the last one rather than merely newer.
