

What AI Video Synthesis Actually Does With Your Data
For decades, the end of a data pipeline looked the same: a chart, a dashboard, a table, a slide. Numbers moved from a database into an image and stopped there. AI video synthesis changes the destination. Instead of a static frame, the same dataset becomes a sequence of moving images — a camera that pushes through a city, particles that swell and collapse with traffic volume, a character who narrates the anomaly you just found.
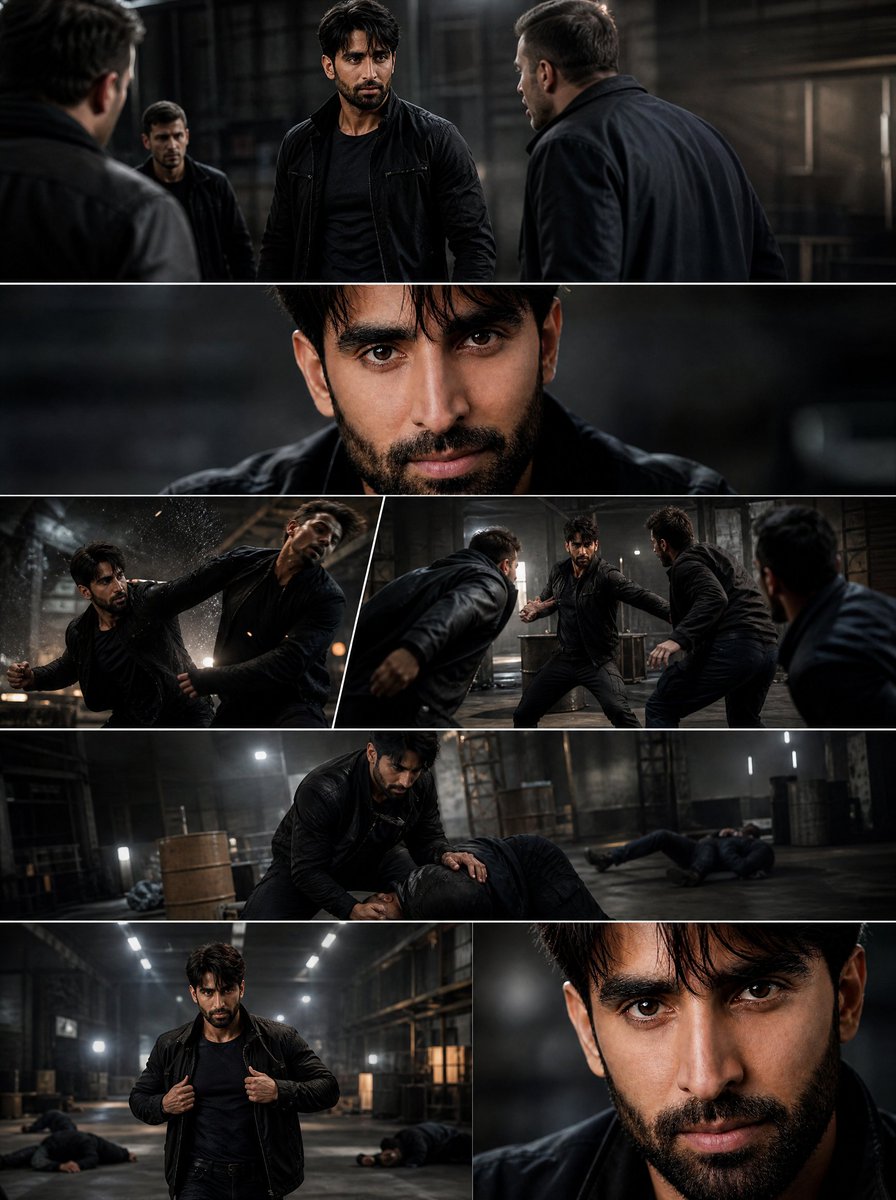
The important distinction is that this is not simply "data visualization with animation." It is a production pipeline where generative models reinterpret structured inputs as scenes. The data drives what appears, when it appears, and how it behaves. The model supplies the texture, lighting, motion, and realism that would otherwise require a film crew.
There are three broad ways teams do this, and most mature workflows combine them:
- Pure generative synthesis. A script or dataset summary is converted into prompts, and a text-to-video or image-to-video model renders each shot. Best for expressive, cinematic, or abstract visuals where literal accuracy matters less than impact.
- Programmatic compositing. Charts, maps, and 3D scenes are rendered deterministically with code, then stylized or augmented with generative elements. Best when the numbers must be exactly right.
- Hybrid pipelines. Deterministic rendering supplies the skeleton, generative models supply the skin and atmosphere, and an editing stage merges both. This is where most professional output lands.
Who is this guide for? Analysts who want their findings to travel further. Journalists turning investigations into watchable pieces. Product teams who need launch videos built from usage numbers. Researchers who want animated explanations. Anyone who has a dataset and a story trapped inside it.
Decide What Kind of Data You Are Actually Working With
Before you open any video tool, classify your input. The data archetype determines the visual grammar, and picking the wrong grammar is the fastest way to produce something that looks impressive and communicates nothing.
Numeric and time-series data
Rates, counts, sensor readings, financials, engagement metrics. These have a natural direction — time runs one way — and a natural magnitude. Visual metaphors that work: rising and falling terrain, growing structures, expanding or contracting volumes, light intensity, speed of motion.
The critical rule: map magnitude to exactly one visual variable per shot. If bar height means revenue and color also means revenue and motion speed also means revenue, the viewer learns nothing except that you own a render engine.
Text and document corpora
Transcripts, surveys, support tickets, research abstracts, legal filings. Here the interesting signals are clustering, sentiment, recurrence, and change over time. Visual metaphors: constellations of nodes that draw closer as themes converge, drifting typographic fields, layered pages that separate and recombine.
Generative video is unusually good at this because it handles soft, ambiguous visuals well. The trade-off is interpretability — a beautiful nebula does not tell a viewer that 31% of complaints mention delivery delays. Pair every abstract shot with one unambiguous label or number.
Spatial and geographic data
Maps, routes, regional comparisons, environmental measurements. These almost always want a deterministic base — a real map projection, correct borders, accurate coordinates — with generative elements layered on top for atmosphere, seasonal change, or scale cues.
Event and behavioral logs
Clickstreams, user journeys, transaction sequences, incident timelines. The value here is sequence and causality. Visual metaphors: a continuous ribbon that branches, a corridor with doors that open and close, a flow that fragments at a specific step.
Once you have classified your data, write one sentence that states the single claim the video must land. If that sentence is vague — "show how our users behave" — you are not ready to synthesize anything.
Choosing Generation Models Without Getting Lost
Model choice is where most teams burn the most time. The market shifts constantly, so build a selection process rather than memorizing a leaderboard.
The four capabilities that actually matter
- Motion realism. Can the model produce believable physical movement, or does everything slide and warp? Test with a shot that requires walking, falling water, or flowing cloth.
- Prompt adherence. Does it render what you asked for, or a mood-board cousin of what you asked for? Test with a prompt containing three specific nouns and one camera instruction.
- Temporal coherence. Do objects stay intact across the clip, or does a chair become a dog in frame 40? Test with a 6-to-10 second clip containing two interacting subjects.
- Controllability inputs. Which inputs does it accept — a first frame, a last frame, a depth map, a pose skeleton, a camera path? The more control surfaces, the more useful it is inside a structured pipeline.
Models that win on motion realism often lose on prompt adherence, and vice versa. That is normal. The practical answer is a small portfolio: one primary model for hero shots, one fast model for b-roll and iteration, and one image-to-video model for anything that needs a fixed starting composition.
Build a one-afternoon test harness
Before committing to any model for a real project, run the same five prompts through the candidates:
- A wide establishing shot with a specific time of day
- A medium shot of a person doing something concrete
- A close-up of a textured surface with directional light
- An abstract data metaphor — expanding rings, drifting particles
- A continuation shot that must match the previous clip's framing
Score each on adherence, coherence, artifacts, and how many attempts it took to get something usable. The attempt count is the most underrated metric. A model that nails a shot on the fifth try is four times more expensive than one that nails it on the first, even if the per-second price looks similar.
Plan for cost and latency honestly
Generative video has two budgets: money and time. Iteration-heavy creative work consumes both quickly, because every prompt tweak is a new render. Three habits keep this under control:
- Storyboard on stills first. Resolve composition, framing, and lighting with image generation, which is far cheaper and faster than video.
- Render low, then high. Draft at reduced resolution and duration, approve, then commit to final quality on approved shots only.
- Freeze the script before rendering. Rewriting narration after the visuals exist forces re-renders of entire sequences.
From Raw Table to Narrative Spine
Data does not have a story; it has a shape. Your job is to find the shape and translate it.
Reduce before you render
A 40-column dataset will not become a video. It will become a mess. Cut to three to five variables maximum, and choose them because they support your single claim, not because they were hard to collect.
Find the beats
Most data stories have three or four beats. A common structure:
- Baseline. What normal looks like, so the viewer has something to compare against.
- Disruption. The change, the outlier, the surprise. This is the emotional center of the piece.
- Mechanism. Why it happened — the segment, region, channel, or behavior driving the shift.
- Consequence. What it means, and what happens next.
Four beats at roughly 20-30 seconds each gives you a 90-120 second piece, which is the sweet spot for attention on most platforms.
Write the script in spoken rhythm
Read every line aloud. Data writing tends to be dense with clauses, and dense clauses collapse when narrated. Target 12-18 words per sentence. One idea per sentence. Numbers spoken as approximations — "nearly tripled" — with the precise figure on screen as a caption.
Designing the Shot List and Prompt System
The shot list is where a data project becomes a film project. Each row should contain: shot number, duration, narrative purpose, visual description, camera instruction, data reference, model assigned, and status.
Prompt anatomy that produces repeatable results
A reliable synthesis prompt has five slots:
- Subject: the concrete thing in frame, described physically rather than conceptually
- Action: what changes across the clip's duration
- Camera: framing, angle, and movement — static, slow push, lateral track, handheld
- Light and palette: time of day, direction, contrast, color temperature
- Texture and reference: film stock, lens character, render style, medium
A weak prompt reads: "show revenue growth." A strong prompt reads: "a single tall glass tower rising from a flat plain of short stone blocks, the tower growing upward steadily and slowing near the top, camera static at a low angle, cool morning light from the left, matte concrete texture with soft dust in the air."
The second version tells the viewer something specific — the rate of growth decelerates — purely through action.
Build a reusable style block
Every project should have a frozen style paragraph: palette, lens family, grain, motion energy, and negative prompts. Paste it into every shot prompt. This single habit does more for visual consistency than any post-processing step.
Guardrails worth adding
- Negative prompts for text artifacts, watermark-like textures, warped faces, extra limbs, and jittery edges.
- Motion limits — cap camera speed, because fast generative movement is where coherence breaks first.
- Forbidden imagery list for anything brand-sensitive, regulated, or legally risky.
Consistency: The Hardest Problem in Long-Form Synthesis
A single eight-second clip is now easy. Twenty clips that feel like one continuous film is still hard. Consistency has three layers, and they need different solutions.
Visual consistency
Solved with a shared reference. Generate one hero still per scene, then run every shot in that scene as image-to-video from variations of that still. Same palette, same lens, same environment — only the action changes.
Temporal consistency
Solved by keeping clips short and cutting on motion. If a clip must exceed ten seconds, generate it in overlapping segments and cut at the overlap point. Never let a model invent a new object mid-clip; introduce objects at cut points where the viewer's eye expects a change.
Brand and factual consistency
Solved with a lock file. Maintain a document containing your exact colors, logo usage rules, approved data labels, and the precise numbers that may appear on screen. Review every rendered frame against it. Generative models will happily produce a suspiciously believable but wrong figure on a chart.
Audio, Voice, and Pacing
Audio is not a finishing touch, it is half the runtime. If the visuals and narration disagree rhythmically, the piece feels broken no matter how good either is.
Narration
Write for the voice, not for the page. If you are using a synthesized voice, generate one paragraph at a time so you can re-record a single sentence without regenerating the whole track. Keep pacing between 140 and 160 words per minute for explanatory content.
Music and sound design
Choose music after the edit is locked, not before. Use one musical shift to mark the disruption beat — a drop, an entrance, a sudden silence. Silence is the most underused tool in data storytelling; it makes the number you place over it land harder.
Captions and accessibility
Burn captions or ship a subtitle file. Add alt-text descriptions for every data visualization. Keep on-screen numbers in a font size that survives mobile playback, and never rely on color alone to distinguish two series.
Assembly and Quality Control
Once shots are approved, assembly is mostly editing discipline: cut between clips at moments of visual similarity, keep total runtime tight, and resist the urge to show every shot you paid for.
A practical review checklist
- Does the video still make sense with the audio muted?
- Is every on-screen number correct and consistent with the narration?
- Do adjacent shots share color temperature and grain?
- Are there any obvious generative artifacts in the first two seconds, where viewers decide whether to keep watching?
- Does the piece end with a specific takeaway, not a logo?
- Have you watched it once on a phone, at low volume, at normal speed?
Common Mistakes and How to Avoid Them
Starting with the model instead of the claim. Teams spend days testing render quality before deciding what the video is about. Write the one-sentence claim first; it eliminates half the model options immediately.
Mapping too many variables to visuals. Beautiful, unreadable. One variable per visual channel.
Ignoring the first three seconds. Attention is decided before your data appears. Lead with the disruption, then explain the baseline.
Chasing photorealism when abstraction is clearer. For most numeric data, a stylized, diagram-like aesthetic communicates better and renders more consistently.
No version discipline. Name files with shot number, version, and model. Regenerating a shot you already approved because you cannot find it is the most avoidable waste in the pipeline.
Skipping the still stage. Every minute saved by going straight to video costs multiples later in re-renders.
Scaling the Workflow
When a one-off video becomes a series, the pipeline needs structure.
- Batch by scene, not by shot. Load the scene's prompts, render all clips, then review together.
- Keep a prompt library. Versioned, tagged, and searchable. Your best prompts are assets.
- Separate roles. Scriptwriter, prompt author, render operator, editor, and fact-checker can be the same person on small projects and must not be on large ones.
- Automate the deterministic parts. Data pulls, chart renders, captions, and file naming should be scripted, not clicked.
- Archive source data with every export. When a number changes, you need to know which shots it touched.
Frequently Asked Questions
How long does a typical data-driven synthesis video take? A 90-second piece with four beats usually takes two to four working days for a small team, with most of that time spent on script and stills rather than video generation.
Can I use generative video for exact charts? Use deterministic rendering for anything that must be numerically precise, then stylize or composite generative elements around it. Never let a generative model draw the chart itself.
What resolution and aspect ratio should I target? Produce a vertical master for social distribution and a 16:9 master for web and presentations. Shoot wider than you need so vertical crops do not lose the subject.
Do I need a 3D artist? Not necessarily, but someone comfortable with composition and lighting will dramatically improve output quality. Generative models reward people who know what a good frame looks like.
How do I keep a series visually unified? One style block, one hero still per scene, one locked palette. Consistency comes from constraints, not from tool quality.
What if the data updates later? Design shots so numbers live in overlays rather than inside generated frames. Updating an overlay takes minutes; re-rendering a scene takes hours.
Bringing It Together
AI video synthesis is best understood as a translation layer between analysis and attention. The hard part was never making pixels move — it is deciding which three numbers deserve to move, and in what order, so that a viewer who has never seen your spreadsheet understands your conclusion in ninety seconds.
Start with the claim. Reduce the data until it hurts. Storyboard on stills. Freeze a style block. Render short, cut on motion, verify every number, and treat audio as a first-class part of the build. Do that consistently and the tooling becomes almost interchangeable — which is exactly where you want to be, because the tools will keep changing and your storytelling standard should not.
