

Why Video Brand Visibility Needs a New Vocabulary
Video is no longer a channel you bolt onto a marketing plan; it is the surface the plan runs on. Feeds autoplay, search results surface clips, product pages embed demos, and support teams answer questions with 40-second screen recordings. When almost everything is video, the old question — "did people see us?" — becomes almost useless. A view can mean a deliberate rewatch or a 0.4-second scroll-past. A follower count can grow while recall quietly shrinks.
That gap is why marketing teams are rebuilding their vocabulary around brand visibility. The goal is no longer counting impressions but describing how a brand enters someone's attention, how long it stays, and what it leaves behind. AI-assisted production makes this harder and more urgent at the same time: harder because volume explodes, more urgent because consistency is now something you can engineer rather than hope for.
This guide lays out that vocabulary, the metrics that support it, and a practical workflow you can run with the tools you already have. It is written for marketers, creative leads, and small production teams who publish video regularly and want to know whether their brand is actually landing.
What Brand Visibility Actually Means in a Video-First Feed
Brand visibility is the measurable probability that a member of your target audience will notice, recognize, and correctly attribute your brand after encountering your video content. Notice, recognize, attribute — three separate events, and most analytics stacks only measure the first, badly.
A useful way to think about it is in three layers that stack on top of each other.
Layer one: presence
Presence is raw exposure. The video was served, it started playing, it appeared in a feed. Presence metrics include impressions, reach, and play starts. They are cheap to collect and easy to inflate. Presence tells you that distribution worked, not that branding worked.
Layer two: perception
Perception is what the viewer takes away. Did they register the logo, the colour, the product, the tone? Perception is measured with watch-through behavior, recall surveys, brand-lift studies, and increasingly with automated perceptual analysis of the footage itself. This is the layer where most teams have a blind spot.
Layer three: persistence
Persistence is what survives after the scroll. Can the viewer describe your product a day later? Did they search for your name instead of the category? Persistence shows up in branded search volume, direct traffic, and repeat viewership — slow signals that are far more durable than a spike in views.
When a dashboard mixes these three layers into a single "performance" number, decisions get worse. A campaign can have excellent presence and near-zero persistence, and the only way to see that is to keep the layers separate.
The Classic Metrics and Where They Break Down
Before adding new terminology, it is worth being honest about the limits of the old set.
Views, reach, and impressions
These count delivery. They are useful for spotting distribution failures — a video that gets 400 impressions when you expected 40,000 is a distribution problem, not a creative problem. Treat them as logistics, not marketing outcomes.
Watch time and average view duration
Watch time is the best cheap proxy for interest that platforms offer. But averages hide bimodal behavior. A 30-second clip with a 40% average view duration might mean most people watched 40%, or it might mean half watched twice and half bounced immediately. Always look at the retention curve, not just the mean.
Engagement rate
Likes, comments, shares, and saves are signals of intent, but they are heavily biased by platform culture and by how the algorithm rewards interaction. A save is usually worth more than a like because saving implies future utility. A share is worth more than both because it carries implicit endorsement.
Follower and subscriber counts
These are lagging indicators of past performance. They tell you nothing about whether your next video will be seen. Use them for community health, not visibility.
New Terminology for the AI Video Era
As generative video tools matured, a second vocabulary emerged to describe things the classic metrics could not. Four terms are worth adopting.
Perceptual metrics
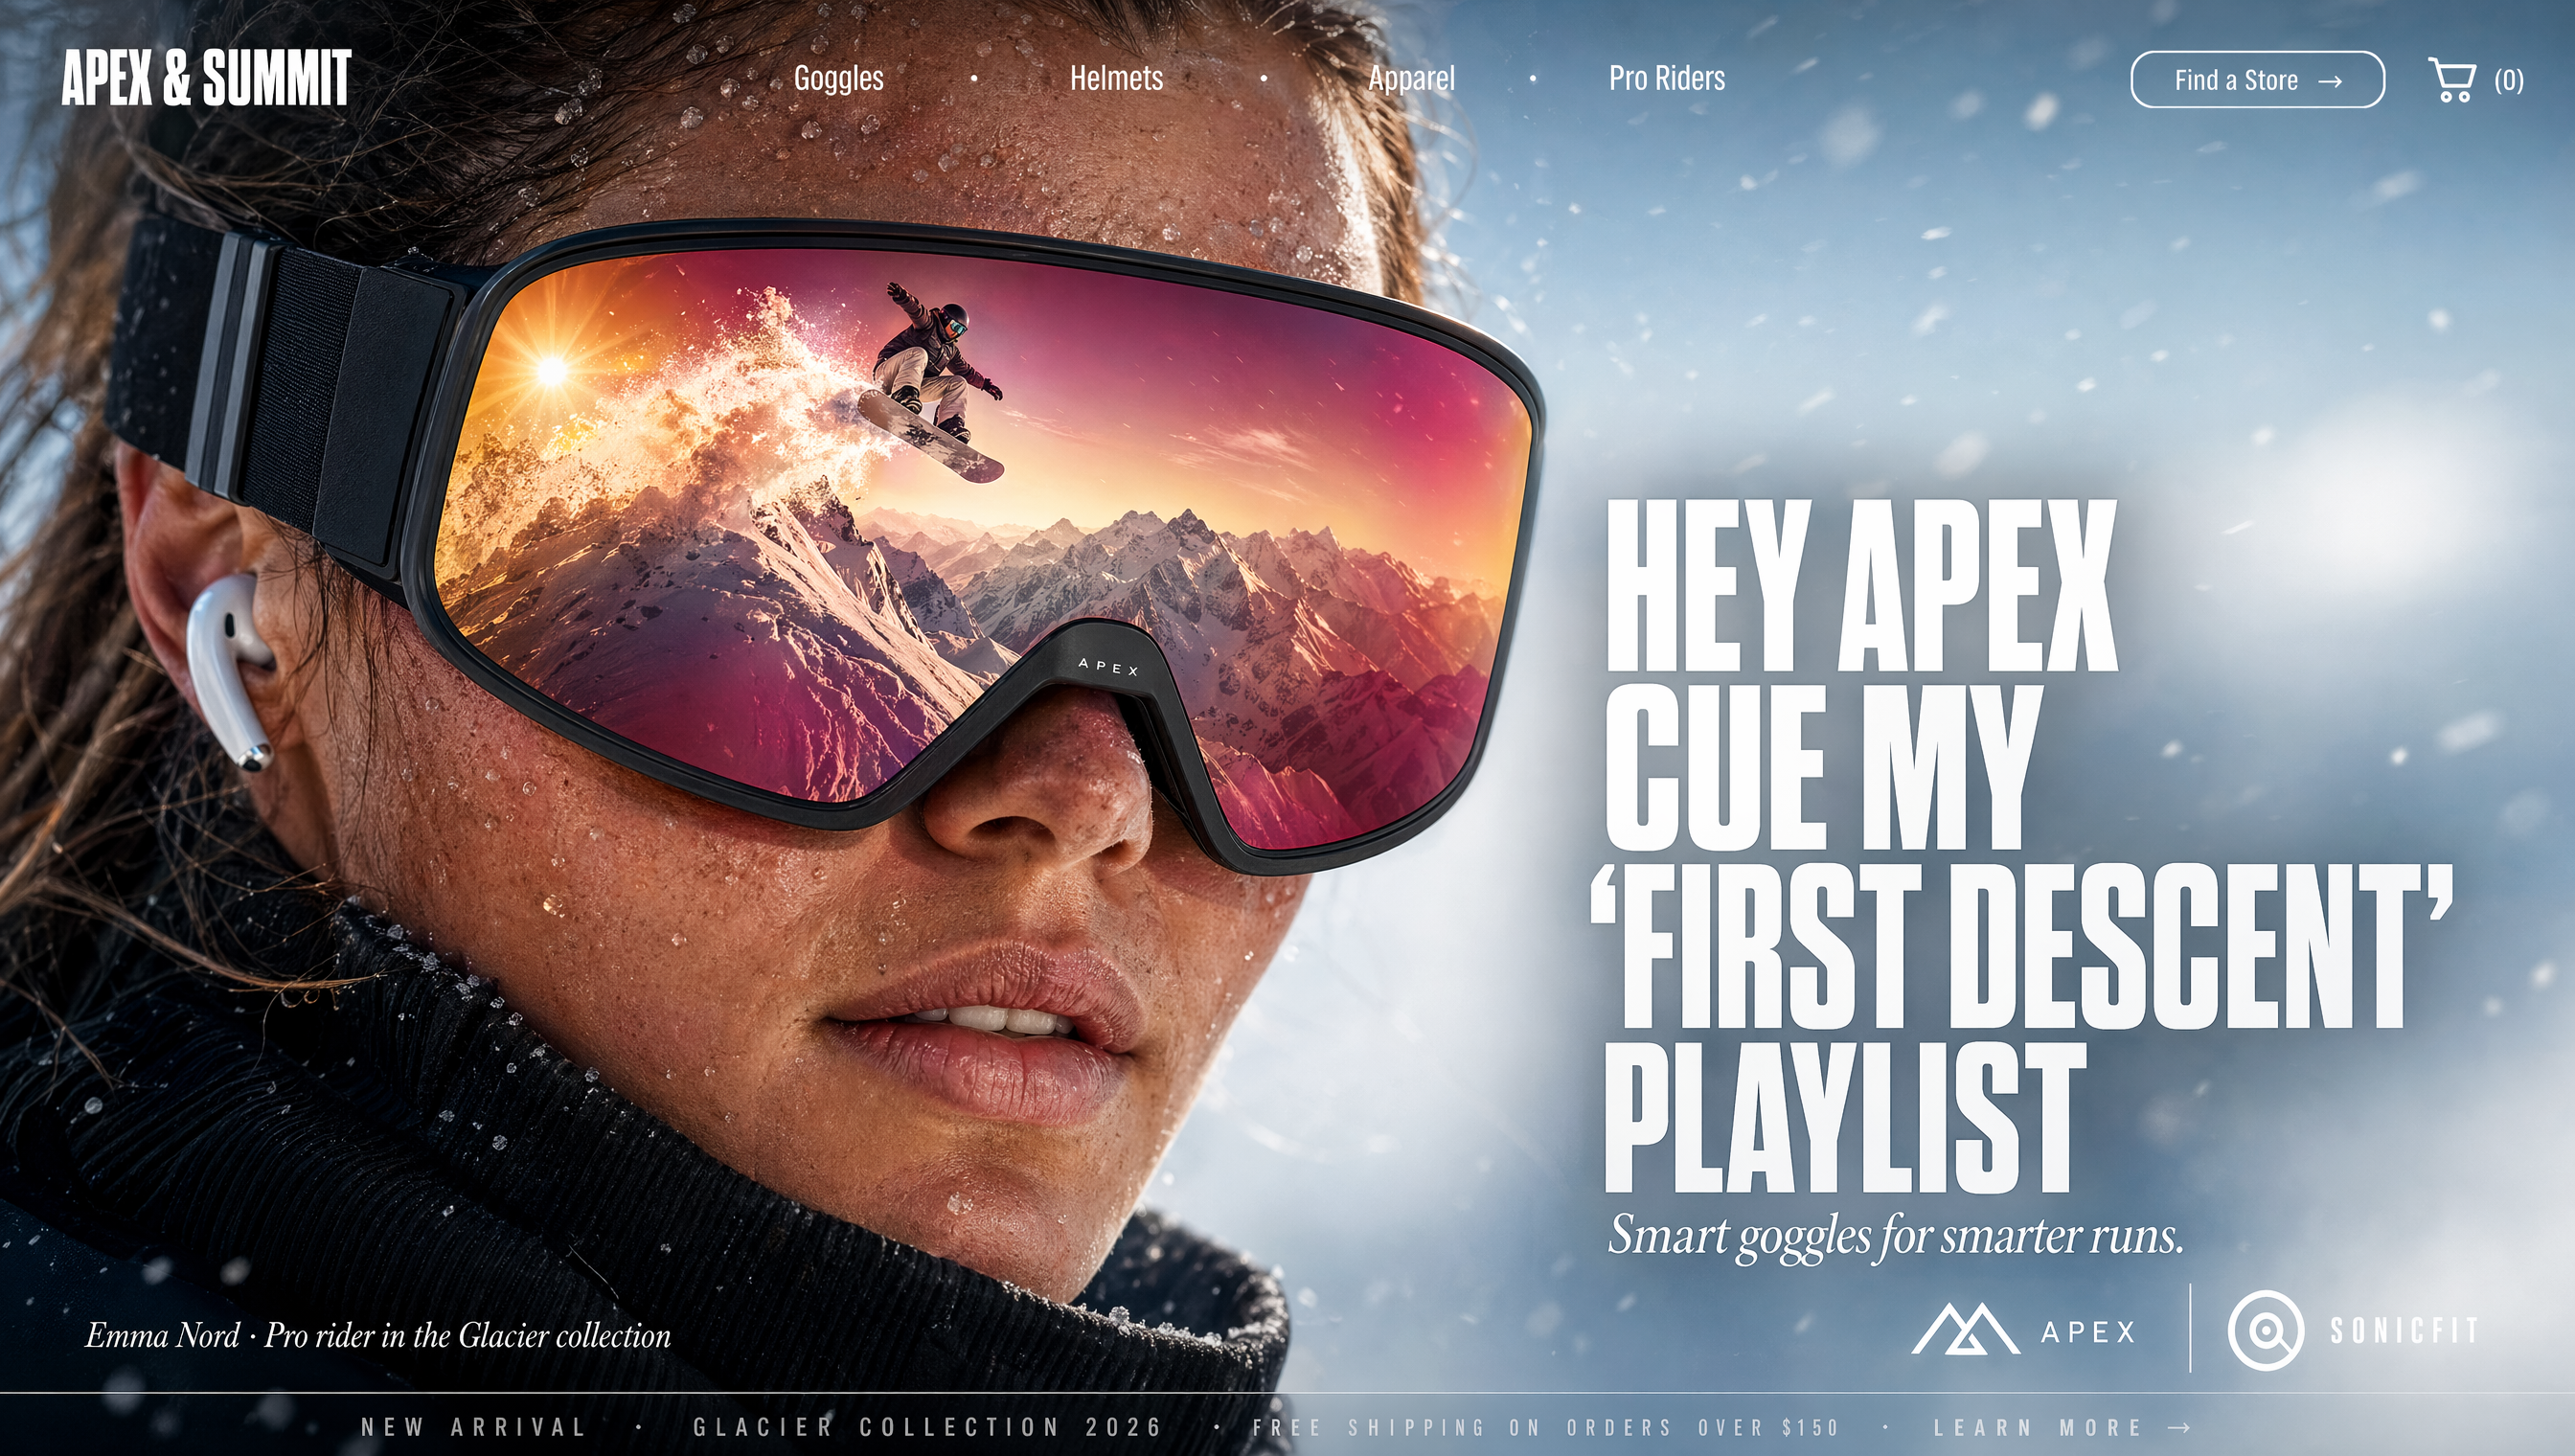
Perceptual metrics describe how the video is likely to be processed by a human, not just whether it played. Typical dimensions include visual salience (where the eye lands first), brand cue prominence (how large and how long the logo or product appears), colour contrast against platform backgrounds, and text legibility at thumbnail size. Some of this can be measured with eye-tracking studies; most of it can be approximated with frame-level analysis and design rules.
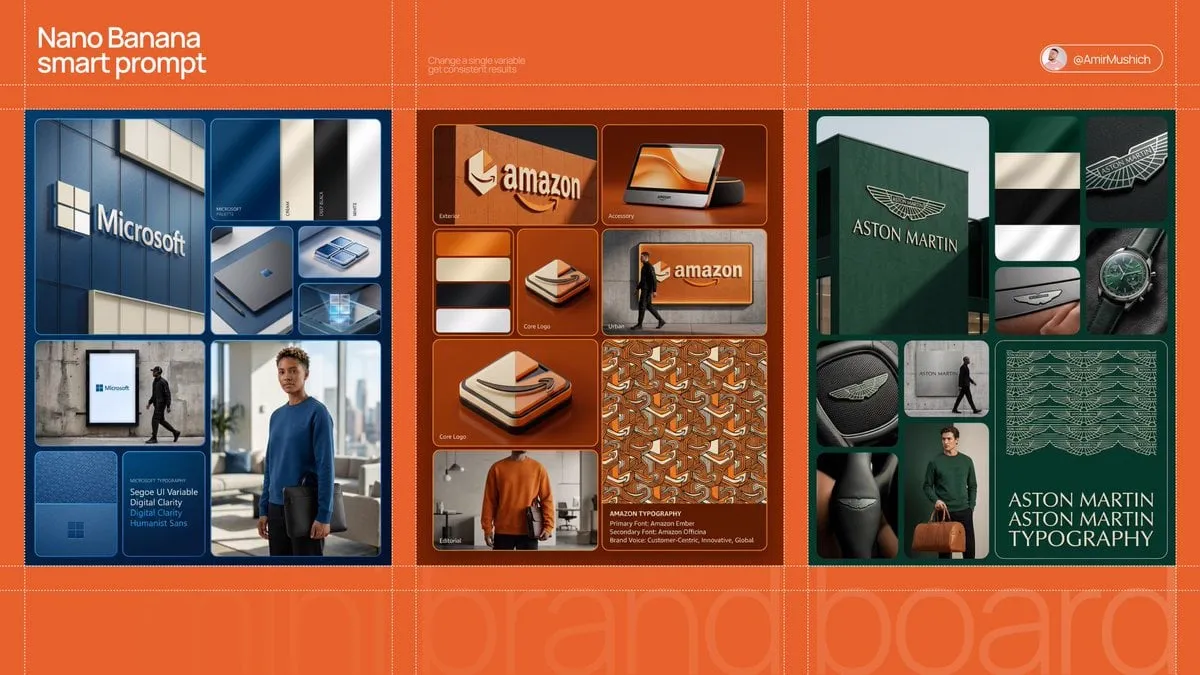
A practical version: define a brand cue budget. For example, "the product must be visible in at least 60% of frames after the 5-second mark, and the logo must reach minimum legible size at least three times, including a final hold of 1.5 seconds." Now you can check compliance before publishing instead of guessing after.
Visual coherence and content fusion
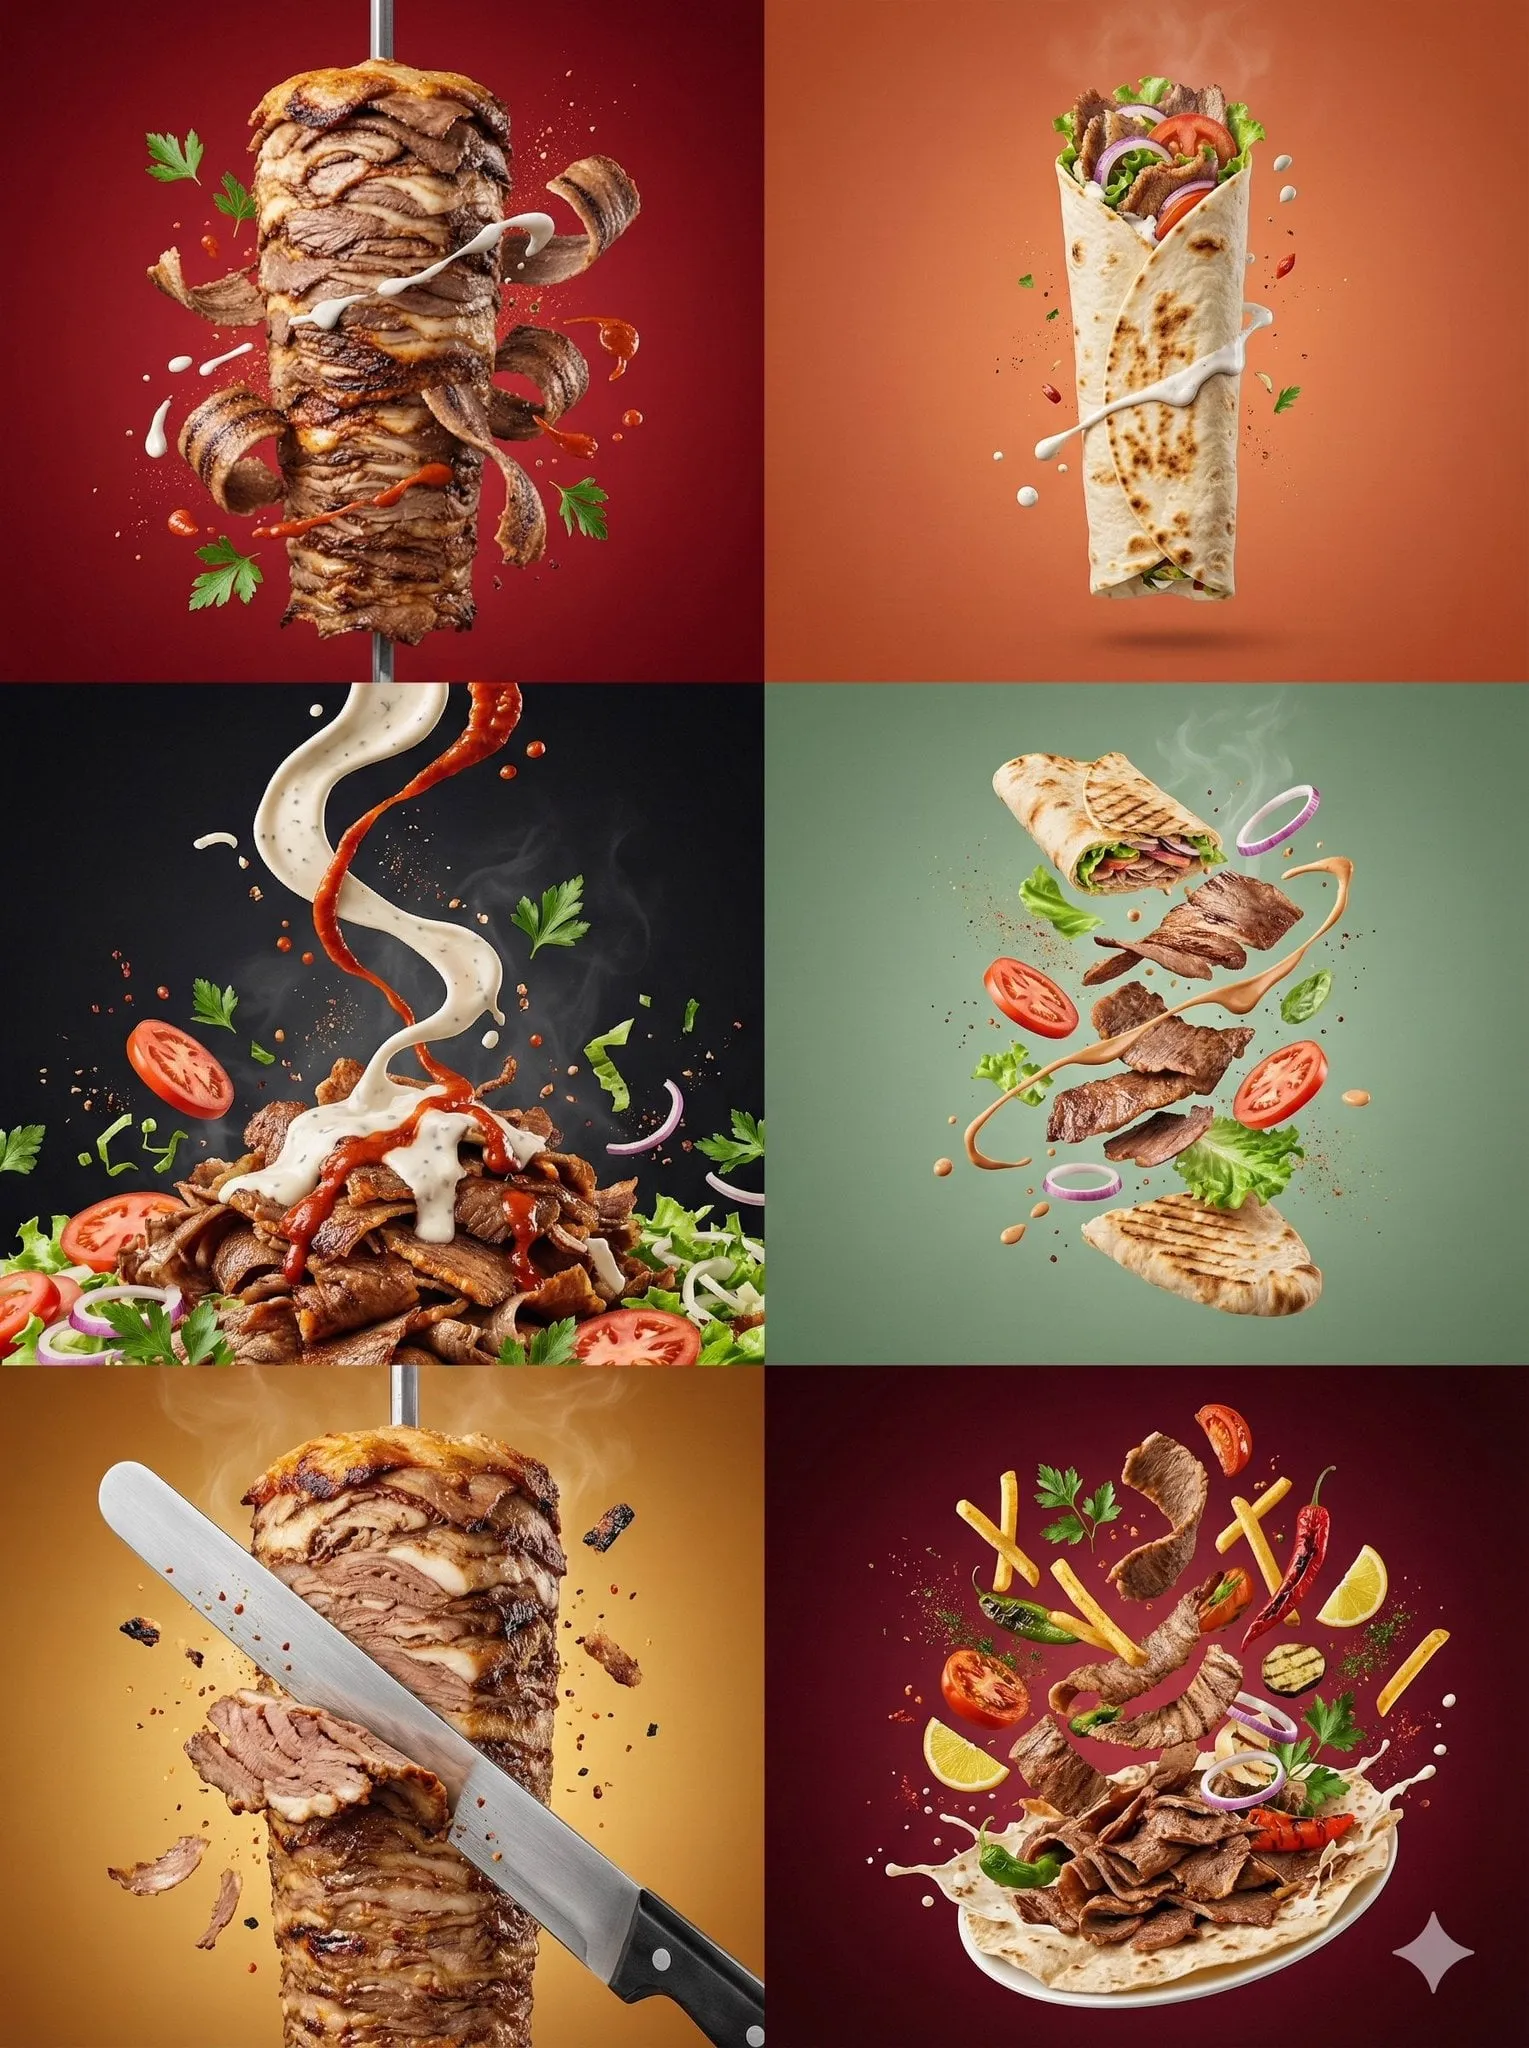
When you generate footage with multiple models or stitch AI shots to live-action plates, style drift is the enemy. Visual coherence measures how stable your look stays across a piece: colour temperature, lens character, grain, motion cadence, character consistency. Content fusion is the practice of blending generated and captured material so the seams don't read as seams.
Coherence matters for visibility because inconsistency reads as low quality, and low quality suppresses retention. If your hook is strong but your third shot looks like a different film, viewers leave before the brand payoff.
Platform-specific visibility index
A single visibility number across all platforms is almost always misleading. Each surface has different rules: vertical short-form rewards a fast hook and on-screen text; long-form rewards narrative pacing; embedded product video rewards clarity; search-driven clips reward keyword-aligned titles and transcripts.
Build a simple platform-specific visibility index that weights the signals that matter on each surface. For short-form, weight hook retention at 3 seconds, completion rate, saves, and branded search lift. For long-form, weight 50% retention point, comment sentiment, and click-through to product pages. For embedded video, weight play rate against page visitors and scroll-away position. Each index is a composite score you can track over time per channel, and the weights are yours to tune.
Attribution durability
Attribution durability describes how long a video keeps producing brand recognition after its publishing peak. A tutorial that gets cited in forums for two years has high durability. A trend-jacking clip that spikes for 48 hours has almost none. Both can be worth making — but only if you know which one you are making.
Building a Brand Visibility Tracking Workflow
The theory is easy. The workflow is where most teams stall. Here is a sequence that works for a team of two to ten people.
Step 1: Define the visibility question
Write one sentence before you open any analytics tool. Examples:
- "Do viewers associate our product category with our brand name after watching?"
- "Does our new visual identity improve 3-second retention on short-form?"
- "Does adding captions and a persistent corner logo increase recognition for sound-off viewers?"
A vague question produces a vague dashboard. One clear question produces three or four specific signals.
Step 2: Choose signals you can actually collect
Map each question to signals you can get without expensive research. A realistic starter set:
- 3-second and 10-second retention from platform analytics
- Completion rate and rewatching
- Saves and shares per thousand views
- Branded search volume change in the two weeks after a campaign
- Direct traffic to the brand's main landing page
- Comment mentions of the brand name or product
Six signals beat sixty. You will actually maintain six.
Step 3: Instrument the creative pipeline
This is the step AI production changes most. If you generate variants, name them systematically so analytics can be joined to creative decisions: hook type, presenter style, aspect ratio, caption style, brand cue placement. A naming convention like hook-question_caption-bold_logo-corner_v3 is unglamorous and extremely effective. Without it, you will have beautiful footage and no idea which version drove the lift.
Step 4: Set a baseline and a cadence
Record four to six weeks of baseline data before you change anything. Then review weekly, not daily. Visibility signals move slowly and daily noise will send you chasing ghosts. A monthly deep review plus a weekly glance is the right rhythm for most teams.
Step 5: Close the loop with creative iteration
Analytics that do not change the next video are overhead. Every review should end with one or two concrete creative decisions: change the hook, hold the product shot longer, move the logo out of the platform's UI overlap zone, cut 6 seconds from the intro. Then test the change in the next batch.
A Practical AI Video Production Pipeline Built for Visibility
Tools change constantly, but the pipeline stages are stable. Here is how to run each stage with visibility in mind.
Pre-production: briefs that encode brand cues
Write a one-page brief with a brand cue plan: what must appear, how large, for how long, and in which frames. Decide the colour and typography rules that survive compression and small screens — thin fonts and low-contrast overlays disappear on phones. Decide the hook in the first three seconds before you generate anything, because generation is fast and cheap and it is far too easy to produce ten beautiful openings that all fail the same way.
Generation: consistency across shots
Whether you are working with Runway, Sora, Kling, Luma, Pika, or open models through a service like ComfyUI pipelines, consistency comes from constraints. Fix aspect ratio, seed where possible, description style, lighting language, and character descriptors. Generate short clips and assemble rather than asking for one long take. When something drifts, regenerate that shot rather than trying to fix it in the edit — patching drift in post is where days disappear.
Post-production: design for the muted viewer
Most feed viewing happens without sound. Captions, on-screen text, and a persistent but tasteful logo position do more for brand recognition than a louder voiceover. Keep text inside platform safe zones so the UI does not crop your brand. Test your thumbnail and first frame at 120 pixels wide; if the product is unrecognizable, redesign the frame.
Distribution: variant strategy
One video everywhere is a compromise everywhere. Produce a horizontal long cut, a vertical short cut, and a square or 4:5 cut for feed placements. Re-cut the hook for each surface. Reuse the same footage, but treat the first three seconds as per-platform work, because that is where retention is won or lost.
Decision Criteria: Choosing Tools Without Getting Buried
There is no single best AI video tool, only better fits for a job. Use these criteria when evaluating anything.
Control versus speed. If you need frame-level control over a brand shot, favour tools with camera, motion, and keyframe controls. If you need volume for testing hooks, favour fast text-to-video with cheap iteration.
Consistency machinery. Does the tool help you keep a character, product, or look stable across shots? Reference-image conditioning, style locking, and shot-to-shot continuation matter more than raw resolution for brand work.
Output flexibility. Can you export at multiple aspect ratios and frame rates without regenerating? Can you get clean plates for text overlays?
Rights and licensing clarity. For commercial brand work, be certain about what you may use commercially and how generated assets are licensed. Ambiguity here is a legal risk, not a creative one.
Integration with your edit. If the tool cannot deliver files your editor can use without conversion gymnastics, it will not survive in a weekly workflow.
A reasonable default stack: one high-control model for hero shots, one fast model for testing and variation, a compositing layer for text and logos, and a spreadsheet or lightweight BI tool for the visibility index. Keep it boring. Boring stacks get used.
Common Mistakes That Destroy Visibility Data
Most measurement programs fail for organisational reasons, not technical ones. These are the recurring patterns.
Chasing vanity spikes. A viral clip with no brand recall is entertainment, not marketing. Track branded search alongside views to see the difference.
Changing five variables at once. If you alter the hook, the voice, the length, the captions, and the posting time, you learn nothing. Change one class of variable per batch.
Judging AI video by texture instead of effect. Slight imperfections in generated footage often do not affect retention at all, while a weak first second always does. Prioritise attention over polish.
Ignoring audio-off reality. If your brand only appears in the spoken script, most viewers never receive it.
Reporting without decisions. Every review meeting should produce a creative change, an owner, and a date.
Forgetting the platform's own UI. Logos placed where a caption block, progress bar, or button sits are effectively invisible. Check safe zones per platform before you lock the edit.
FAQ
How long before visibility metrics become meaningful?
For short-form, retention and save patterns stabilize in about two to three weeks of consistent posting. Branded search and direct traffic need six to eight weeks to show a trend. Do not draw conclusions from a single video.
Do I need survey-based brand lift to track visibility?
No, though it helps. A combination of retention curves, saves, branded search, and direct traffic gives you a usable picture at a fraction of the cost. Surveys are worth it when you are making a large media commitment and need to justify it.
Can AI-generated video build brand recognition as well as live action?
It depends on brand cue discipline, not on whether footage is generated. If the logo is legible, the product is central, and the look is consistent, recognition works. Where generated video struggles is in subtle human authenticity, so lean on your product and design language rather than performance nuances.
What is the single most useful metric to start with?
Retention at three seconds, paired with branded search change over two weeks. The first tells you whether you earned attention; the second tells you whether attention turned into memory.
How many video variants should I test at once?
Three to five per concept. Fewer gives you weak signal; more becomes unmanageable and dilutes your ability to attribute results.
Key Takeaways
- Brand visibility has three layers — presence, perception, persistence — and they should never be blended into one number.
- Classic metrics measure delivery. Perceptual metrics, visual coherence, platform-specific indexes, and attribution durability measure impact.
- Define one visibility question, pick six signals, and review on a weekly and monthly cadence.
- Instrument your creative pipeline with naming conventions so analytics can be joined to creative choices.
- Design every video for sound-off viewing and platform safe zones; that is where most brand cues are lost.
- Choose AI tools by control, consistency, flexibility, and licensing clarity rather than by demo reels.
- Close every review with a creative decision. Measurement that does not change the next video is just decoration.
