
Create
AI Math Video Generator
Turn math concepts into animated teaching videos. Describe equations, diagrams, and solution steps in text, then generate and review.
AI Video Generator
0/20000 characters
Cost:10
My videos
Loading...



How do I create animated math videos?
Write a description of the math concept, equation, or diagram you want to visualize. Describe equations in words, include labels and positions, and specify the motion or sequence of steps. Choose your settings, generate, and review the animated result.
AI Math Video Generator
Geometry visualization
Input
An animated triangle with labeled sides a, b, c and the Pythagorean theorem a squared plus b squared equals c squared appearing next to it
Expected output
An animated geometry diagram showing a right triangle with labeled sides and the equation floating nearby
Graph animation
Input
A coordinate plane with a parabolic curve being drawn in real time, x and y axes labeled
Expected output
An animated graph showing a parabola being drawn on labeled axes from left to right
Step-by-step solution
Input
A sequence showing an algebraic equation being solved step by step with each operation highlighted in order
Expected output
An animation showing equation steps appearing one by one with current operation highlighted
Generate animated math teaching videos from text descriptions of equations, diagrams, and step-by-step solutions
Visual math explanations
Turn abstract equations and concepts into animated diagrams that make math more intuitive to understand.
Custom teaching clips
Generate math visualizations for specific lessons. Describe the exact concept, equation, or diagram you need.
Reusable learning aids
Create a library of math animations for different topics. Use them across lessons, presentations, or study materials.
How It Works
1
Describe your scene
Describe the desired scene and motion.
2
Choose your settings
Choose the available generation settings.
3
Generate and download
Generate, review, and download a suitable result.
Tips for math prompt accuracy
Describe mathematical elements visually, not symbolically.
Input Constraints
- Describe equations in words rather than relying on the model to render symbols correctly
- Include colors, positions, and labels to guide the visual layout
- Focus on one concept or step per clip to avoid visual confusion
- Always verify the mathematical accuracy of the generated visual against source material
Practical Tips
- Write equations as words such as 'x squared plus y squared equals r squared'
- Describe the motion of elements appearing, highlighting, or moving into position
- Use directional words like left to right, top to bottom for sequences
- Generate short clips for individual steps and combine them later if needed
Privacy
- Do not upload personal or sensitive material unless you have permission to use it.
Usage Rights
- Confirm that you have the rights needed for the inputs and intended use of the result.
Prompt recipes
Copy a structure, then adjust the subject, lighting, camera, and output details for your own result.
Pythagorean theorem proof visualization
A right triangle with sides labeled a, b, and c on a white background, squares forming on each side, the squares on a and b colored blue and red, the square on c colored green, equation a squared plus b squared equals c squared appearing below.
Visual proof combines geometric shapes with algebraic notation, color coding helps distinguish components, and spatial layout reinforces the relationship.
Quadratic formula derivation step sequence
Starting with a x squared plus b x plus c equals zero on the left, each algebraic step appears below the previous one, operations highlighted in yellow as they occur, final quadratic formula appearing at the bottom.
Vertical step progression with highlighting shows the logical flow, making a complex derivation easier to follow visually.
Sine wave graphing animation
A coordinate grid with x-axis labeled from zero to two pi and y-axis from negative one to one, a smooth red sine wave being drawn from left to right, key points marked with dots at zero, pi over two, pi, three pi over two, and two pi.
Real-time drawing motion demonstrates how the function behaves over its domain, key point markers anchor understanding of the wave cycle.
Fraction addition with common denominator
Two fractions, one third and one fourth, appearing side by side, arrows pointing down to equivalent fractions four twelfths and three twelfths, then combining to seven twelfths, each step appearing sequentially.
Sequential appearance with visual arrows guides the viewer through the multi-step process, reinforcing the logic of finding common denominators.
Area of a circle derivation visual
A circle divided into wedges like a pizza, wedges rearranging into a parallelogram shape, labels showing radius r and circumference pi r, area formula A equals pi r squared appearing, animated transformation from circle to parallelogram.
Geometric transformation visually proves the area formula, bridging intuition and algebra through motion.
Best use cases
Match the workflow to the input you have and the result you need before opening the generator.
Classroom lesson visual aid
Input: Specific math concept with step-by-step breakdown and labeled elements
Result: Animated clip for projector or screen during live teaching
Tool: Text-to-video with clear labels, simple colors, and sequential motion
Online course module content
Input: Foundational concept with visual proof or derivation sequence
Result: Embedded video for asynchronous learning platforms
Tool: Text-to-video with narration-friendly pacing and horizontal framing
Math homework help video
Input: Step-by-step solution to a specific problem type with highlighting
Result: Tutorial video for YouTube or homework help site
Tool: Text-to-video with clear step markers and easy-to-follow progression
Study guide supplementary animation
Input: Core formula or theorem with visual proof or application example
Result: Short video reference for exam prep or concept review
Tool: Text-to-video with minimal text, high visual clarity, and looping-friendly design
Limitations to know before generating
- Rendered equations and symbols may not be perfectly accurate—always verify mathematical correctness before showing to students.
- Complex multi-step derivations require separate clips per step; the tool does not auto-sequence long proofs.
- Text labels and numbers may be illegible or misplaced; review and regenerate if clarity is insufficient.
- The tool generates silent video—add narration or explanation separately for full teaching value.
- Abstract math concepts may not translate visually without creative prompt design.
- Generated visuals are teaching aids, not replacements for rigorous mathematical instruction.
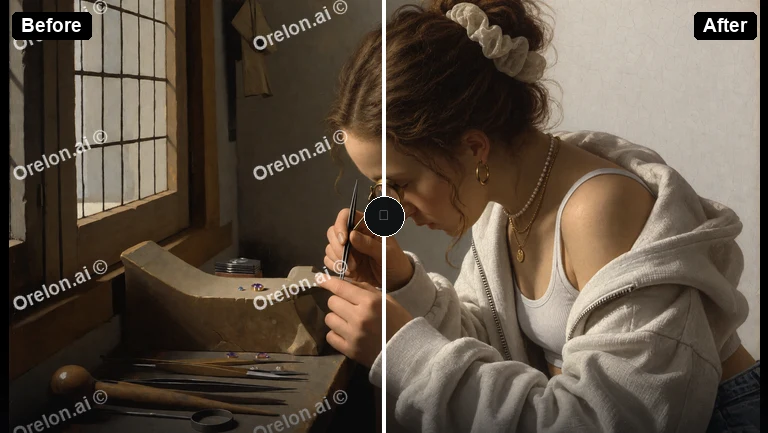
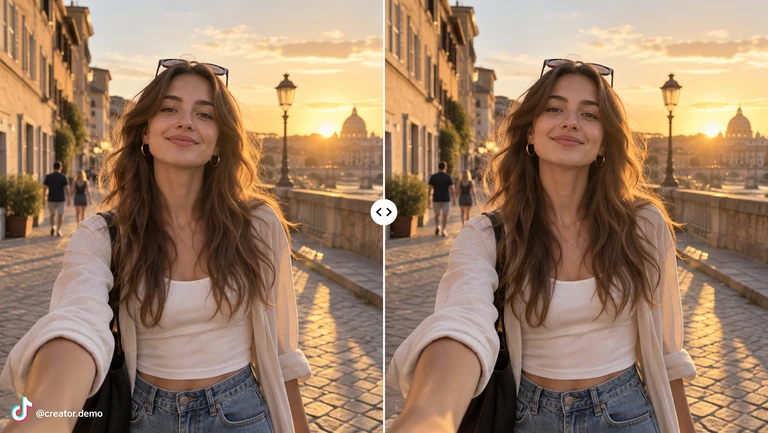
Creative Suite: AI Video Generator & AI Image Generator Tools
Power up your creative workflow with our AI-driven tools. Generate stunning videos, create images, and apply custom adjustments - our AI Video Generator and AI Image Generator offer a complete solution for all your creative needs.
Strictly Prohibits Adult/NSFW Content






Pricing
Choose the credit package that works best for you.
No hidden fees • Cancel anytime • Unused credits roll over
Starter
Perfect for trying out AI creation.
Credits
200 credits / month
- Up to 20 videos per month
- Up to 100 images per month
$6.99/ month$9.9930% OFF
Billed monthly
First-time subscribers get 30% off their first month, then standard price
What's included
- Credits never expire
- Standard models
- HD, Watermark-Free Downloads
- Private Generation
- Faster Generation Speed
- Ad-free experience
Basic
Perfect for light creators.
Credits
500 credits / month
- Up to 50 videos per month
- Up to 250 images per month
$13.99/ month$19.9930% OFF
Billed monthly
First-time subscribers get 30% off their first month, then standard price
What's included
- Credits never expire
- Standard models
- HD, Watermark-Free Downloads
- Private Generation
- Faster Generation Speed
- Ad-free experience
Pro
PopularBest value for creators
Credits
1,200 credits / month
- Up to 120 videos per month
- Up to 600 images per month
$39.99/ month
Billed monthly
What's included
- Credits never expire
- All models + Early access to new models
- HD, Watermark-Free Downloads
- Private Generation
- Faster Generation Speed
- Ultra HD resolution
- Ad-free experience
Ultra
For video creators and power users.
Credits
5,000 credits / month
- Up to 500 videos per month
- Up to 2,500 images per month
$99.99/ month
Billed monthly
What's included
- Credits never expire
- All models + Early access to new models
- HD, Watermark-Free Downloads
- Private Generation
- Faster Generation Speed
- Ultra HD resolution
- Ad-free experience
Free
Standard models only — upgrade to unlock premium models.
Credits
10 free credits on signup
Questions? Contact us at support@domer.io
Create math animations
Open the text-to-video tool, describe the math concept you want to visualize, and generate an animated teaching clip.